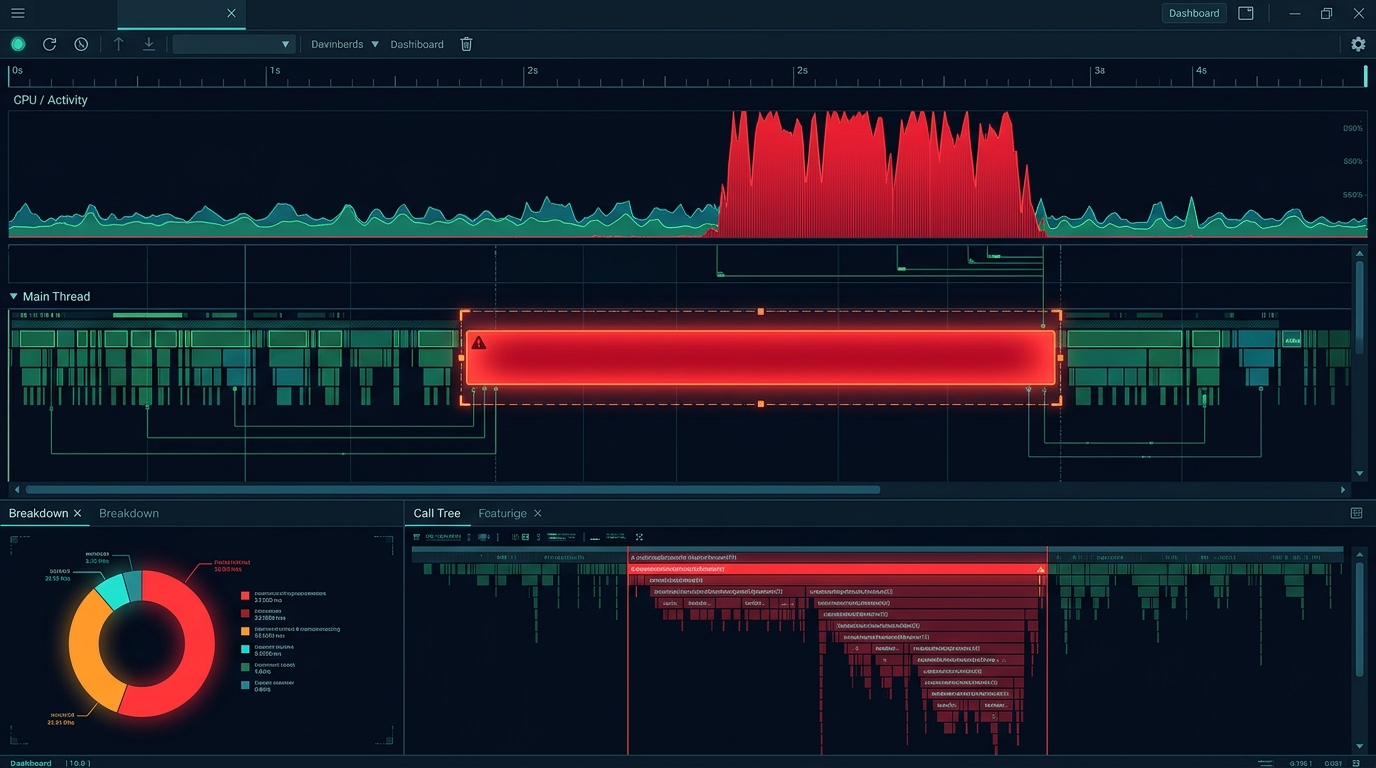
Debugging a Bad INP Score: The Actual Steps, Not Just "Optimize JavaScript"
Open Chrome DevTools' Performance panel, interact with the page the way a real user would (click a filter, open a menu, add to cart), and look at the specific long task blocking the main thread during that interaction — not the whole page load.
Most often it's an event handler doing synchronous DOM work that should be deferred, a third-party script (chat widget, analytics pixel) running heavy logic on every click, or a re-render cascade triggered by state updates that touch more of the page than necessary.
Defer or lazy-load third-party scripts first — usually the biggest single win with the least app-code risk. Then break up long synchronous handlers with requestIdleCallback or similar. Only then look at reducing render scope, which is the most invasive fix and should be last.